Table of Contents
-
Understanding UV Spectroscopy in Peptide Analysis
-
How UV Spectroscopy Works for Peptide Testing
-
Why UV Spectroscopy Matters for Peptide Purity
-
How to Test Peptides Using UV Spectroscopy
-
What to Look for in Peptides During UV Analysis
-
Detecting Peptide Contamination with UV Methods
-
How to Check Peptide Purity Through Spectroscopic Analysis
-
Understanding Peptide Certificate of Analysis and UV Data
-
Third Party Peptide Testing and Quality Verification
-
UV Spectroscopy vs HPLC for Peptides
-
Common Issues Found During UV Peptide Testing
-
How to Know if Peptides Are Contaminated Using UV Data
-
Interpreting UV Spectroscopy Results for Peptides
-
Peptide Storage and Degradation Signs
-
Final Thoughts on UV Spectroscopy for Peptide Quality
-
Frequently Asked Questions
Understanding UV Spectroscopy in Peptide Analysis
The Foundation of Modern Peptide Testing
UV spectroscopy represents one of the most fundamental techniques used in peptide testing laboratories worldwide. This analytical method measures how peptides absorb ultraviolet light at specific wavelengths, providing critical information about their structure and purity. When researchers and manufacturers need reliable data about peptide quality, UV spectroscopy offers a fast, non-destructive approach that requires minimal sample preparation. The technique has become indispensable in pharmaceutical development, research settings, and quality control operations where peptide integrity must be verified before use.
Molecular Principles Behind UV Absorption
The science behind UV spectroscopy relies on the natural properties of peptide bonds and aromatic amino acids. These molecular components absorb UV light at characteristic wavelengths, creating distinct spectral patterns that serve as molecular fingerprints. Understanding these patterns helps laboratories determine whether a peptide sample meets purity standards or contains unwanted contaminants that could compromise its effectiveness. This forms the basis for peptide quality control methods used across the industry.
How UV Spectroscopy Works for Peptide Testing
Light Absorption Across the UV Spectrum
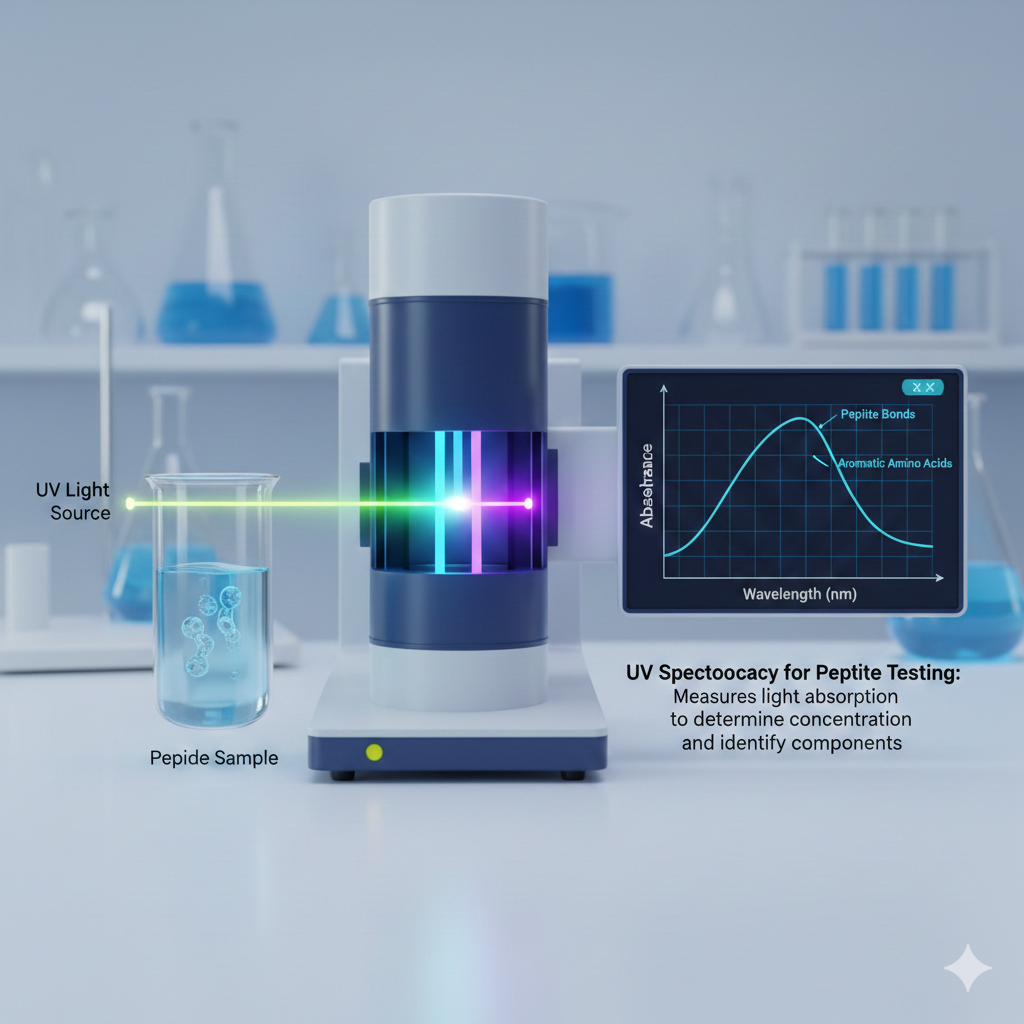
The operational principle of UV spectroscopy centers on measuring light absorption across the ultraviolet spectrum, typically between 190 and 400 nanometers. When a peptide sample is exposed to UV light, specific chemical bonds and amino acid residues absorb energy at predictable wavelengths. The instrument records this absorption data and generates a spectrum showing absorption intensity versus wavelength. This spectrum provides quantitative information about peptide concentration and qualitative insights into molecular composition that peptide testing services rely upon.
Characteristic Absorption Patterns in Peptides
Most peptides show strong absorption around 214 nanometers due to peptide bond transitions. Aromatic amino acids like tyrosine, tryptophan, and phenylalanine create additional absorption peaks between 250 and 290 nanometers. By analyzing these characteristic peaks, technicians can identify the presence of specific amino acids and calculate overall peptide concentration with remarkable accuracy. These measurements become essential components of comprehensive peptide batch testing protocols.
Why UV Spectroscopy Matters for Peptide Purity
The Critical Role of Purity Assessment
Peptide purity directly impacts efficacy, safety, and research validity, making accurate purity assessment absolutely essential for research grade peptides. UV spectroscopy serves as a primary screening tool that quickly identifies major impurities and confirms that peptide samples meet minimum quality thresholds. While not as detailed as HPLC or mass spectrometry, UV analysis provides immediate feedback about sample quality without extensive preparation or analysis time. Understanding peptide purity vs net peptide content requires multiple analytical approaches working together.
Rapid Quality Screening Advantages
When manufacturers ask how to check peptide purity efficiently, UV spectroscopy often represents the first line of defense. The technique detects protein aggregates, truncated sequences, and certain chemical contaminants that alter absorption patterns. This rapid assessment capability allows laboratories to reject substandard batches early in the testing process, saving time and resources that would otherwise be spent on more expensive analytical methods. This efficiency makes UV spectroscopy valuable for routine peptide quality control methods.
How to Test Peptides Using UV Spectroscopy
Sample Preparation Requirements
Testing peptides with UV spectroscopy begins with proper sample preparation, which typically involves dissolving the peptide in an appropriate solvent at known concentrations. Water, buffer solutions, or organic solvents may be used depending on peptide solubility characteristics. The dissolved sample is then transferred to a specialized cuvette made from UV-transparent quartz or fused silica, as standard glass absorbs UV light and interferes with measurements. Proper preparation ensures accurate results for how to verify peptide authenticity.
Conducting the Spectroscopic Measurement
The spectrophotometer scans the sample across the UV spectrum while a reference cuvette containing only the solvent provides baseline correction. Modern instruments automate this process, generating absorption spectra within seconds. Technicians compare the resulting spectrum against reference standards for that specific peptide, looking for characteristic peaks at expected wavelengths and noting any unexpected absorption that might indicate contamination or degradation. These procedures align with GMP peptide testing standards when applicable.
What to Look for in Peptides During UV Analysis
Key Spectral Indicators of Quality
When evaluating peptide quality through UV spectroscopy, several key indicators reveal sample integrity. The primary absorption maximum should appear at the wavelength predicted by the peptide's amino acid composition. For peptides containing aromatic residues, secondary peaks should match theoretical predictions based on sequence data. The overall shape of the absorption curve provides clues about structural integrity and the presence of aggregates. Knowing what to look for in peptides requires understanding both theoretical expectations and practical variations.
Recognizing Normal Versus Abnormal Patterns
Understanding what to look for in peptides requires recognizing normal versus abnormal spectral features. A clean peptide sample produces smooth, well-defined peaks with minimal baseline noise. Irregular peak shapes, unexpected shoulders, or absorption at unusual wavelengths often signal problems. The ratio between absorption at different wavelengths can also reveal contamination, particularly when comparing peptide bond absorption at 214 nanometers against aromatic absorption at higher wavelengths. These observations help third party peptide testing laboratories provide accurate assessments.
Detecting Peptide Contamination with UV Methods
Types of Contamination UV Can Identify
UV spectroscopy excels at identifying certain types of peptide contamination, though its capabilities have specific limitations. Protein contaminants typically produce elevated absorption at 280 nanometers relative to expected values for the target peptide. Nucleic acid contamination manifests as increased absorption around 260 nanometers, creating distinctive spectral features that experienced analysts recognize immediately. Chemical additives from synthesis or purification processes may contribute unexpected absorption across various wavelengths, helping analysts determine how to know if peptides are contaminated.
Understanding Detection Limitations
The method proves particularly valuable for detecting gross contamination that significantly alters spectral properties. However, UV spectroscopy cannot identify all contaminant types, especially those lacking chromophores or present at low concentrations. For comprehensive contamination screening, laboratories combine UV analysis with complementary techniques like HPLC and mass spectrometry to achieve complete characterization. This multi-method approach ensures thorough evaluation when you need to verify peptide authenticity through independent testing.
How to Check Peptide Purity Through Spectroscopic Analysis
Mathematical Basis for Purity Calculation
Calculating peptide purity via UV spectroscopy involves comparing measured absorption values against theoretical predictions based on amino acid composition. The Beer-Lambert law provides the mathematical framework, relating absorption intensity to concentration and path length. By measuring absorption at characteristic wavelengths and applying known extinction coefficients, analysts determine peptide concentration and assess whether it matches labeled specifications. This calculation method helps distinguish peptide purity vs net peptide content in analytical reports.
Ensuring Accurate Purity Measurements
For those wondering how to check peptide purity quantitatively, the process requires accurate reference standards and careful technique. Spectrophotometers must be properly calibrated, solvents must be pure, and sample handling must prevent degradation or loss. Even small errors in concentration measurements can significantly impact purity calculations, so laboratories implement strict quality control procedures to ensure reliable results. Professional peptide testing services maintain these standards consistently across all analyses.
Understanding Peptide Certificate of Analysis and UV Data
How to Read Peptide COA Documentation
A peptide certificate of analysis serves as the official documentation of quality testing results, and UV spectroscopy data typically appears as a key component. When reviewing how to read peptide COA documents, look for the UV spectrum or absorption values at specific wavelengths, usually 214 and 280 nanometers. The certificate should indicate the measured peptide concentration, calculated purity percentage, and the methodology used for determination. Reputable suppliers provide detailed COA information that allows customers to verify reported quality claims.
Interpreting UV Data Within Certificates
Understanding the UV spectroscopy section of a peptide certificate of analysis requires knowledge of expected values for your specific peptide sequence. Compare the reported absorption ratios against theoretical calculations to verify consistency. The COA should specify the solvent used, concentration tested, and any deviations from expected spectral characteristics. Third party peptide testing laboratories often provide more comprehensive documentation that includes raw spectral data alongside interpreted results, offering greater transparency in quality verification.
Third Party Peptide Testing and Quality Verification
The Importance of Independent Analysis
Third party peptide testing provides unbiased verification of peptide quality, removing potential conflicts of interest when manufacturers test their own products. Independent laboratories like Optima Labs use standardized peptide quality control methods to assess samples without preconceptions about expected results. This objective approach helps researchers and buyers verify peptide authenticity when purchasing from new suppliers or validating critical research materials. Many institutions now require third party verification for peptides used in clinical or published research.
How to Verify Peptide Authenticity Through Testing
Learning how to verify peptide authenticity involves more than reviewing supplier documentation. Submitting samples for independent analysis ensures the peptide matches its claimed identity, purity, and concentration. Third party testing typically employs multiple analytical techniques including UV spectroscopy, HPLC, and mass spectrometry to build comprehensive quality profiles. This verification process protects against mislabeled products, degraded materials, or intentional substitution, which can occur in unregulated peptide markets.
UV Spectroscopy vs HPLC for Peptides
Comparing Analytical Capabilities
Understanding UV spectroscopy vs HPLC for peptides helps laboratories select appropriate testing strategies. UV spectroscopy offers rapid concentration determination and preliminary purity screening but provides limited resolution for detecting closely related impurities. HPLC separates peptide mixtures chromatographically, revealing individual impurity peaks that UV spectroscopy alone cannot distinguish. While UV analysis might indicate overall purity of ninety percent, HPLC can identify and quantify specific contaminants comprising that remaining ten percent.
Complementary Roles in Quality Testing
Rather than competing technologies, UV spectroscopy and HPLC serve complementary roles in comprehensive peptide testing services. Laboratories often use UV spectroscopy for initial screening and concentration measurement, then employ HPLC for detailed purity determination and impurity profiling. This tiered approach optimizes resource allocation while ensuring thorough quality assessment. Some advanced HPLC systems incorporate UV detection, combining separation power with spectroscopic analysis in a single workflow for maximum information yield.
Common Issues Found During UV Peptide Testing
Technical Challenges in Spectroscopic Analysis
Several recurring problems affect UV spectroscopy results and require careful attention during analysis. Sample turbidity from particulates or aggregates scatters light and produces artificially elevated absorption readings that misrepresent true peptide concentration. Improper baseline correction when solvent composition differs between sample and reference cuvettes creates systematic errors. Peptide degradation during storage or handling alters absorption spectra, potentially masking quality issues or generating false positives for contamination. These challenges emphasize why peptide batch testing requires standardized protocols.
Environmental and Procedural Factors
Temperature fluctuations can shift absorption wavelengths and intensities, introducing variability in measurements. Contaminated cuvettes from inadequate cleaning procedures carry over residues that interfere with subsequent analyses. Understanding these common pitfalls helps laboratories implement preventive measures and recognize when unusual results warrant investigation rather than acceptance at face value. Professional quality control methods account for these variables through environmental controls and rigorous cleaning validation.
How to Know if Peptides Are Contaminated Using UV Data
Identifying Contamination Through Spectral Analysis
Recognizing contamination through UV spectroscopy requires systematic evaluation of spectral features against expected patterns. When absorption ratios deviate significantly from theoretical values, contamination becomes likely. For example, an A280/A214 ratio much higher than predicted suggests protein impurities, while elevated A260 readings indicate nucleic acid presence. Unexpected peaks or shoulders at wavelengths where the peptide should not absorb strongly signal foreign substances. These indicators help answer the critical question of how to know if peptides are contaminated.
Implementing Quality Control Through Pattern Recognition
The question of how to know if peptides are contaminated extends beyond simple peak identification to pattern recognition and comparison against batch history. Establishing baseline spectral characteristics for each peptide product enables quality control teams to spot deviations quickly. Trending absorption data over time reveals gradual contamination or degradation that single measurements might miss, supporting proactive quality management. Regular monitoring helps identify when peptides require replacement before compromising experimental results.
Interpreting UV Spectroscopy Results for Peptides
Understanding Spectral Data
Proper interpretation of UV spectra requires understanding both the theoretical basis of absorption and practical considerations affecting measurements. Peak wavelengths should align with predictions based on amino acid composition, accounting for environmental factors like pH and solvent effects that can shift absorption maxima. Peak heights correlate with concentration through extinction coefficients, but this relationship assumes pure samples and accurate path length measurements. Experienced analysts develop intuition for recognizing when results require additional investigation.
Evaluating Result Quality and Consistency
Experienced analysts evaluate overall spectral quality, looking for smooth curves without irregular features that suggest instrumental problems or sample issues. They assess whether absorption intensity falls within expected ranges and whether multiple wavelength measurements yield consistent concentration calculations. Discrepancies between different analytical approaches prompt further investigation to resolve the underlying cause before reporting final results. This careful evaluation ensures research grade peptides meet the stringent standards required for reliable scientific work.
Peptide Storage and Degradation Signs
How to Store Peptides Properly
Understanding how to store peptides properly preserves sample integrity and prevents degradation that can confuse quality testing results. Most peptides remain stable when stored frozen at minus twenty or minus eighty degrees Celsius in tightly sealed containers with desiccants to prevent moisture exposure. Lyophilized peptides generally show better stability than solutions, which can degrade through hydrolysis or oxidation. Avoid repeated freeze-thaw cycles that accelerate degradation and always store peptides away from light, which can damage photosensitive residues.
Recognizing Peptide Degradation Signs
Identifying peptide degradation signs through UV spectroscopy helps prevent use of compromised materials. Degraded peptides often show altered absorption ratios as chemical modifications change chromophore properties. Aggregation produces increased turbidity and light scattering that elevates baseline readings. Color changes in solid peptides or solutions indicate oxidation or other chemical reactions. Comparing current UV spectra against historical data for the same batch reveals subtle changes that suggest degradation, prompting more detailed analysis or sample replacement.
Final Thoughts on UV Spectroscopy for Peptide Quality
The Continuing Value of UV Analysis
UV spectroscopy remains an essential tool in the peptide testing arsenal despite the availability of more sophisticated analytical techniques. Its combination of speed, simplicity, and cost-effectiveness makes it indispensable for routine quality control and preliminary screening. While UV analysis cannot replace comprehensive characterization methods for critical applications, it provides valuable information that guides subsequent testing decisions and helps laboratories allocate resources efficiently. The technique serves as the foundation for many peptide quality control methods.
Integrating UV Spectroscopy into Quality Programs
As peptide therapeutics and research applications continue expanding, reliable testing methods become increasingly important for ensuring product quality and reproducibility. UV spectroscopy serves this need by offering accessible technology that delivers meaningful results without requiring extensive expertise or expensive infrastructure. When integrated thoughtfully into comprehensive quality control programs alongside complementary analytical techniques, UV spectroscopy contributes significantly to maintaining the high standards necessary for peptide science and medicine. Third party peptide testing laboratories leverage UV spectroscopy as part of multi-technique validation strategies.
Frequently Asked Questions
What is the best method to test peptide purity?
The best method for testing peptide purity depends on your specific requirements and available resources. High-performance liquid chromatography remains the gold standard for purity determination, offering excellent resolution and the ability to detect impurities at low levels. However, comprehensive peptide characterization typically employs multiple techniques including HPLC, mass spectrometry, and UV spectroscopy. For routine screening and concentration determination, UV spectroscopy provides fast, cost-effective results that help prioritize samples for more detailed analysis. The most reliable approach combines several complementary methods to build a complete quality profile that meets research grade peptides standards.
How can you tell if a peptide has gone bad?
Peptides show several signs of degradation that indicate they have gone bad. Visual inspection may reveal discoloration, clumping, or changes in texture from the original appearance. UV spectroscopy can detect alterations in absorption patterns that suggest molecular changes or aggregation. The most definitive way to assess peptide degradation involves analytical testing including HPLC to measure purity changes, mass spectrometry to identify degradation products, and bioactivity assays if applicable. Proper storage in frozen conditions with desiccants significantly extends peptide shelf life and reduces degradation risk. Comparing current analysis against the original peptide certificate of analysis helps identify quality changes over time.
What wavelength is used for peptide detection?
Peptide detection typically uses wavelengths around 214 nanometers for maximum sensitivity to peptide bonds, which absorb strongly at this wavelength due to the pi to pi-star transition. For peptides containing aromatic amino acids like tryptophan, tyrosine, or phenylalanine, detection at 280 nanometers provides good sensitivity while reducing interference from other compounds. Some applications use 254 nanometers as a compromise between sensitivity and selectivity. The optimal wavelength selection depends on the specific peptide sequence, the analytical method being used, and the types of impurities expected in the sample. Professional peptide testing services select wavelengths based on peptide composition.
How do you measure peptide concentration using UV?
Measuring peptide concentration using UV spectroscopy involves applying the Beer-Lambert law, which relates absorption to concentration through the equation A equals epsilon times c times l. First, dissolve the peptide in an appropriate solvent and measure its absorption at a characteristic wavelength, typically 214 or 280 nanometers. The extinction coefficient epsilon can be calculated from the amino acid sequence or determined experimentally using a standard of known concentration. Divide the measured absorption by the product of the extinction coefficient and the cuvette path length to obtain the peptide concentration in your sample. This method appears frequently in how to read peptide COA documentation.
What are the signs of contaminated peptides?
Contaminated peptides exhibit several warning signs that quality control testing can identify. Unusual coloration or cloudiness in dissolved samples often indicates impurities or degradation products. UV spectroscopy may reveal unexpected absorption peaks or altered absorption ratios compared to reference standards. HPLC analysis shows additional peaks beyond the main peptide peak, indicating the presence of related impurities or contaminants. Mass spectrometry can detect molecules with incorrect molecular weights. Physical properties like solubility may differ from expected behavior. Any deviation from established specifications for a particular peptide product warrants investigation and potentially rejecting the batch. Third party peptide testing provides objective contamination assessment.
How do I verify peptide authenticity from a supplier?
To verify peptide authenticity from a supplier, start by requesting a detailed peptide certificate of analysis that includes multiple analytical methods such as HPLC, mass spectrometry, and UV spectroscopy results. Review the COA carefully to ensure it shows testing appropriate for the claimed peptide sequence and purity. Consider submitting a sample for independent third party peptide testing to confirm the supplier's claims without bias. Reputable suppliers welcome verification testing and provide batch-specific documentation rather than generic certificates. Check that mass spectrometry confirms the correct molecular weight and that purity values are supported by actual chromatographic data rather than just stated percentages.
What is the difference between peptide purity and net peptide content?
Peptide purity vs net peptide content represent different quality measurements that both matter for research applications. Peptide purity typically refers to the percentage of the desired peptide sequence relative to all peptide-related materials in the sample, usually measured by HPLC. Net peptide content accounts for non-peptide components like counterions, residual solvents, and water that contribute to total sample weight. A peptide might show ninety-five percent purity by HPLC but only seventy percent net peptide content due to significant salt or water content. Understanding both values ensures accurate dosing calculations and fair comparisons between suppliers. Quality certificates should report both measurements for complete transparency.